
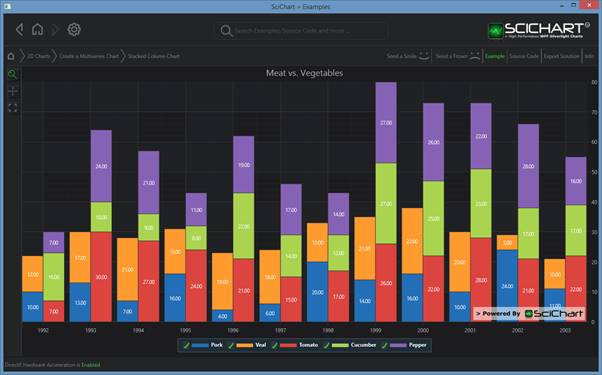
Stacked Columns are provided by the StackedColumnRenderableSeries Type.
Examples for the Stacked Columns Chart can be found in the SciChart WPF Examples Suite which can be downloaded from the SciChart Website or our SciChart.WPF.Examples Github Repository.
Declaring a StackedColumnRenderableSeries in XAML / Code-Behind
| Declaring a StackedColumnRenderableSeries |
Copy Code |
|---|---|
<!-- Create the chart surface --> <s:SciChartSurface> <!-- Declare RenderableSeries --> <s:SciChartSurface.RenderableSeries> <s:StackedColumnRenderableSeries x:Name="columnSeries1" DataPointWidth="0.9" Fill="#FF226Fb7" Stroke="#333" ShowLabel="True" Spacing="0" StackedGroupId="Meat" /> <s:StackedColumnRenderableSeries x:Name="columnSeries2" DataPointWidth="0.35" Fill="#ffff9a2e" Stroke="#333" ShowLabel="True" StackedGroupId="Meat" /> <s:StackedColumnRenderableSeries x:Name="columnSeries3" Fill="#ffdc443f" Stroke="#333" ShowLabel="True" Spacing="0" StackedGroupId="Vegetables" /> <s:StackedColumnRenderableSeries x:Name="columnSeries4" DataPointWidth="0.35" Fill="#ffaad34f" Stroke="#333" ShowLabel="True" StackedGroupId="Vegetables" /> <s:StackedColumnRenderableSeries x:Name="columnSeries5" DataPointWidth="0.35" Fill="#ff8562b4" Stroke="#333" ShowLabel="True" StackedGroupId="Vegetables" /> </s:SciChartSurface.RenderableSeries> <!-- X & Y Axis omitted for Brevity --> </s:SciChartSurface> | |
| Declaring a StackedColumnRenderableSeries |
Copy Code |
|---|---|
// Then in code-behind, e.g. in the OnLoaded event handler var porkData = new double[] { 10, 13, 7, 16, 4, 6, 20, 14, 16, 10, 24, 11 }; var vealData = new double[] { 12, 17, 21, 15, 19, 18, 13, 21, 22, 20, 5, 10 }; var tomatoesData = new double[] { 7, 30, 27, 24, 21, 15, 17, 26, 22, 28, 21, 22 }; var cucumberData = new double[] { 16, 10, 9, 8, 22, 14, 12, 27, 25, 23, 17, 17 }; var pepperData = new double[] { 7, 24, 21, 11, 19, 17, 14, 27, 26, 22, 28, 16 }; var dataSeries1 = new XyDataSeries<double, double> { SeriesName = "Pork" }; var dataSeries2 = new XyDataSeries<double, double> { SeriesName = "Veal" }; var dataSeries3 = new XyDataSeries<double, double> { SeriesName = "Tomato" }; var dataSeries4 = new XyDataSeries<double, double> { SeriesName = "Cucumber" }; var dataSeries5 = new XyDataSeries<double, double> { SeriesName = "Pepper" }; const int data = 1992; for (int i = 0; i < porkData.Length; i++) { dataSeries1.Append(data + i, porkData[i]); dataSeries2.Append(data + i, vealData[i]); dataSeries3.Append(data + i, tomatoesData[i]); dataSeries4.Append(data + i, cucumberData[i]); dataSeries5.Append(data + i, pepperData[i]); } using (sciChart.SuspendUpdates()) { columnSeries1.DataSeries = dataSeries1; columnSeries2.DataSeries = dataSeries2; columnSeries3.DataSeries = dataSeries3; columnSeries4.DataSeries = dataSeries4; columnSeries5.DataSeries = dataSeries5; } | |
NOTE: You can also declare RenderableSeries using full MVVM (series ViewModels). Please see MVVM DataSeries / RenderableSeries API for more details.
Declaring a StackedColumnRenderableSeries in Pure Code
| Declaring a StackedColumnRenderableSeries |
Copy Code |
|---|---|
// Declare the chart and renderable series var sciChartSurface = new SciChartSurface(); var columnSeries1 = new StackedColumnRenderableSeries() { DataPointWidth = 0.9, Fill = new SolidColorBrush(Color.FromArgb(0xFF, 0x22, 0x6F, 0xB7)), Stroke = Color.FromArgb(0xFF, 0x33, 0x33, 0x33), ShowLabel = true, Spacing = 0, SpacingMode = SpacingMode.Absolute, StackedGroupId = "Vegetables" }; var columnSeries2 = new StackedColumnRenderableSeries() { DataPointWidth = 0.9, Fill = new SolidColorBrush(Color.FromArgb(0xFF, 0x22, 0x6F, 0xB7)), Stroke = Color.FromArgb(0xFF, 0x33, 0x33, 0x33), ShowLabel = true, Spacing = 0, SpacingMode = SpacingMode.Absolute, StackedGroupId = "Vegetables" }; // ... sciChartSurface.RenderableSeries.Add(columnSeries1); sciChartSurface.RenderableSeries.Add(columnSeries2); var tomatoesData = new double[] { 7, 30, 27, 24, 21, 15, 17, 26, 22, 28, 21, 22 }; var cucumberData = new double[] { 16, 10, 9, 8, 22, 14, 12, 27, 25, 23, 17, 17 }; var dataSeries0 = new XyDataSeries<double, double> { SeriesName = "Tomato" }; var dataSeries1 = new XyDataSeries<double, double> { SeriesName = "Cucumber" }; const int data = 1992; for (int i = 0; i < tomatoesData.Length; i++) { dataSeries0.Append(data + i, tomatoesData[i]); dataSeries1.Append(data + i, cucumberData[i]); } using (sciChart.SuspendUpdates()) { columnSeries1.DataSeries = dataSeries0; columnSeries2.DataSeries = dataSeries1; } | |
How the Stacking and Grouping Works for Column Series
StackedColumnRenderableSeries has a property StackedGroupId which defines how columns are grouped and stacked. When two StackedColumnRenderableSeries have a StackedGroupId set the grouping behaves differently. Some examples below to help visualize how this feature works.
e.g.
Two Columns, same (or Unset) StackedGroupID (the default)
By default, the StackedGroupId is null. When this is unset, or, when set to the same value, columns stack vertically
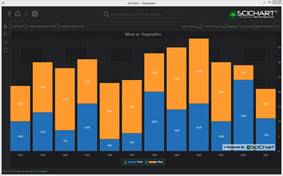
Orange = no StackedGroupId, Blue = no StackedGroupId
Two Columns, different StackedGroupId
When the StackedGroupID is different on two columns, then the columns are grouped. This allows you to have multiple stacked groups.
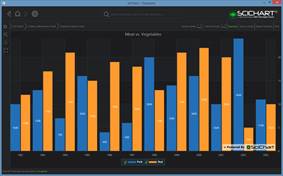
Orange = StackedGroupId A, Blue = StackedGroupId B
Three Columns, (2 with one StackedGroupId, 1 with another StackedGroupId)
To demonstrate the purpose of StackedGroupId, below we have set one column to one StackedGroupId, and two other columns to another StackedGroupId. This creates two stacked groups, one with Orange/Red series (which have the same StackedGroupID) and another with the blue series.
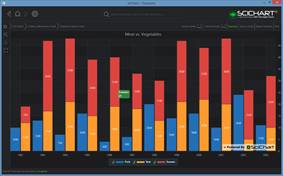
Orange, Red = StackedGroupID A, Blue = StackedGroupID B
Limitations of Stacked Series
When using any Stacked Series type, there are a few important limitations to keep in mind to ensure correct rendering and behavior:
- Consistent X-Values Across Series
All series within a stacking group must share the same X-values – meaning the collections must be of equal length and contain identical values in the same order. This requirement ensures that columns are stacked properly and aligned accurately on the X-axis - X-Values Must Be Valid Numeric Values
The X-values used in stacked column charts must be valid, finite numeric values. Special values such asDouble.NaN,Double.PositiveInfinity, orDouble.NegativeInfinityare not supported and will lead to undefined behavior or rendering issues - Representing Gaps in Series
If you need to represent missing data or create gaps in individual series (e.g., when one series has fewer data points than the others), assignDouble.NaNorFloat.NaNto the corresponding Y-values instead. This tells SciChart to omit rendering the column at that position while preserving the required structure of matching X-values across the group